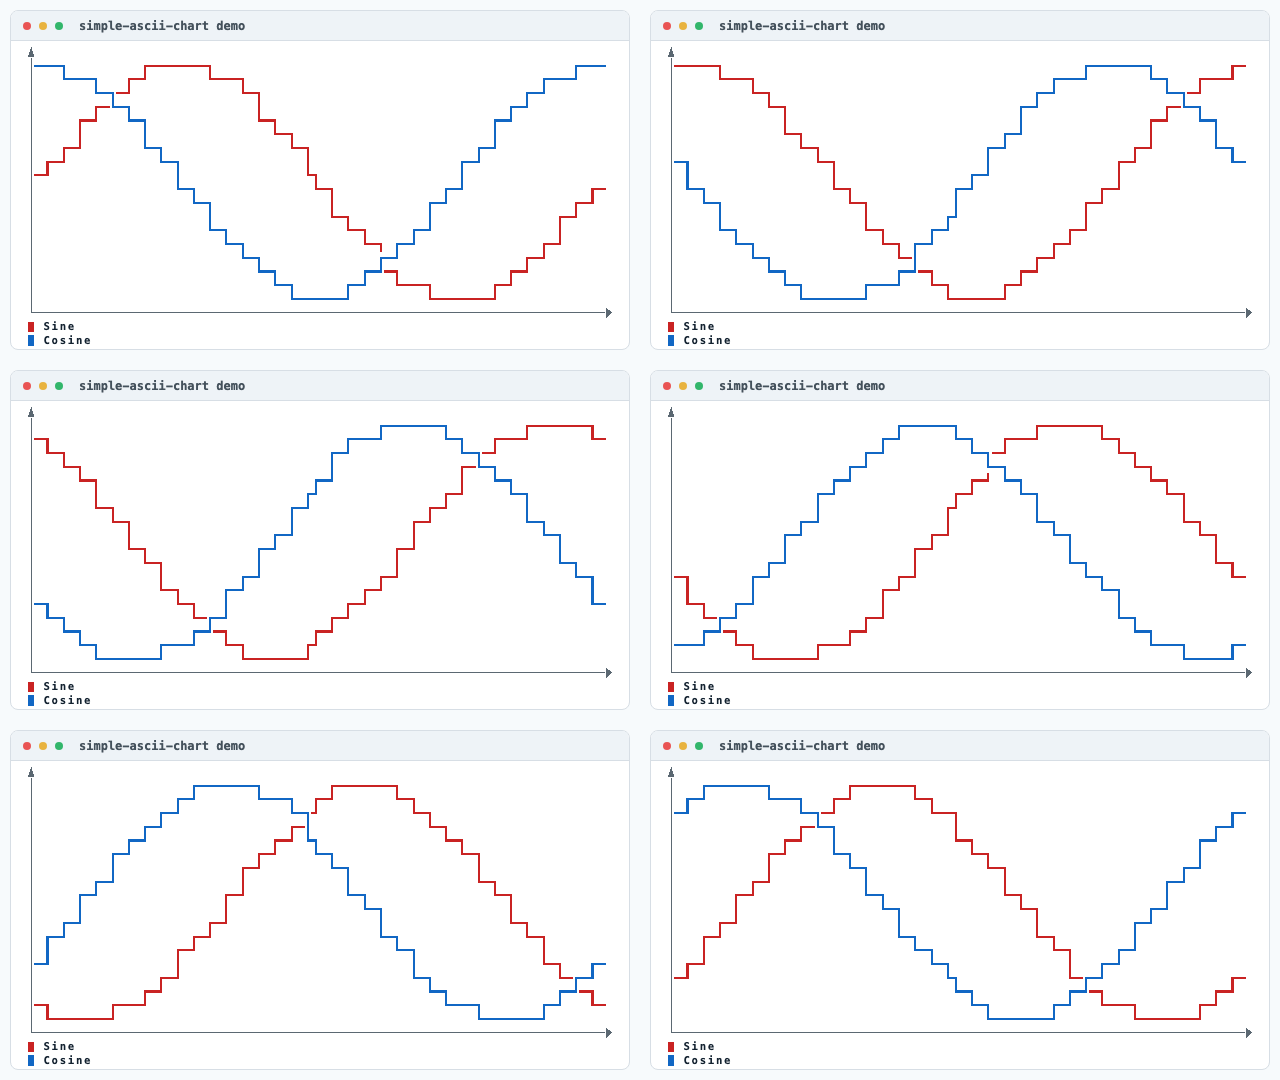
Example code
let step = 0;
const interval = 0.1;
const maxPoints = 20;
const sinPoints: Point[] = [];
const cosPoints: Point[] = [];

setInterval(() => {
  console.clear();

  sinPoints.push([step, Math.sin(step)]);
  cosPoints.push([step, Math.cos(step)]);

  if (sinPoints.length > maxPoints) sinPoints.shift();
  if (cosPoints.length > maxPoints) cosPoints.shift();

  console.log(
    plot([sinPoints, cosPoints], {
      showTickLabel: true,
      color: ['ansiRed', 'ansiBlue'],
      width: 120,
      height: 16,
      yRange: [-1, 1],
      xLabel: 'Step (π)',
      yLabel: 'Amplitude',
      legend: { position: 'bottom', series: ['Sine', 'Cosine'] },
      axisCenter: [undefined, 0],
      formatter: (x, { axis }) => {
        if (axis === 'y') return x;
        return `${(x / Math.PI).toFixed(1)}π`;
      },
    }),
  );

  step += interval;
}, 200);